What’s it for?
Great for budget forecasting, procurement planning, and capacity rationalization.
- Measure actual trunk usage against capacity
- See if traffic demand is increasing or decreasing
- Forecast how many channels or how much bandwidth you will actually need
- Correctly scale the size of trunk groups
- Control costs
Where do I find it?
Trunk Group Trend Reports are available in VSM’s Capacity Manager module in Reports. Capacity Manager’s library of useful reports let you track utilization of hardware and software across your UC platform.
Trunk Group Trend Reports in Action
Click on the screen to watch a demonstration of Trunk Group Trend Reports.
Trunk Group Trend Report Example 1
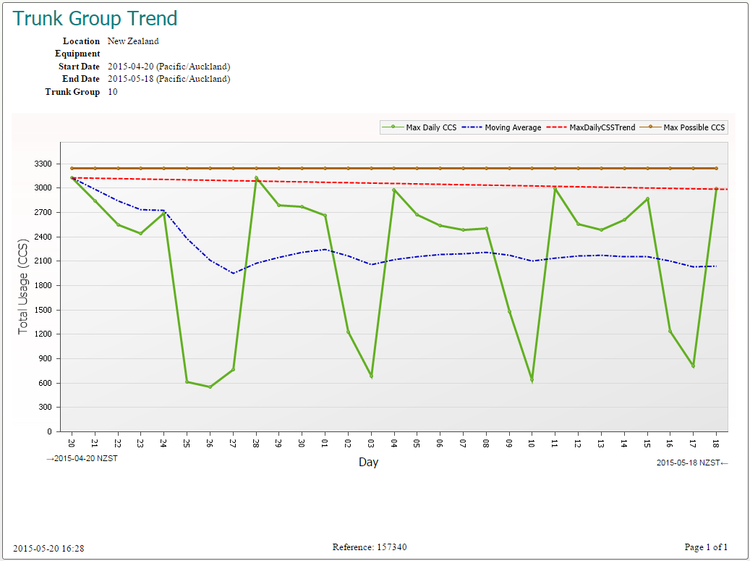
The Trunk Group Trend Report can be used to visualize the rate of consumption of trunks over a period of time. Using this report data, decisions can be made on the basis of firm information.
The graph below shows a trunk group that is at or near its capacity, indicated by the top brown line. However, over the period of the report the peak loading is diminishing, as shown by the red dotted line, so there is no need to expand this trunk group.
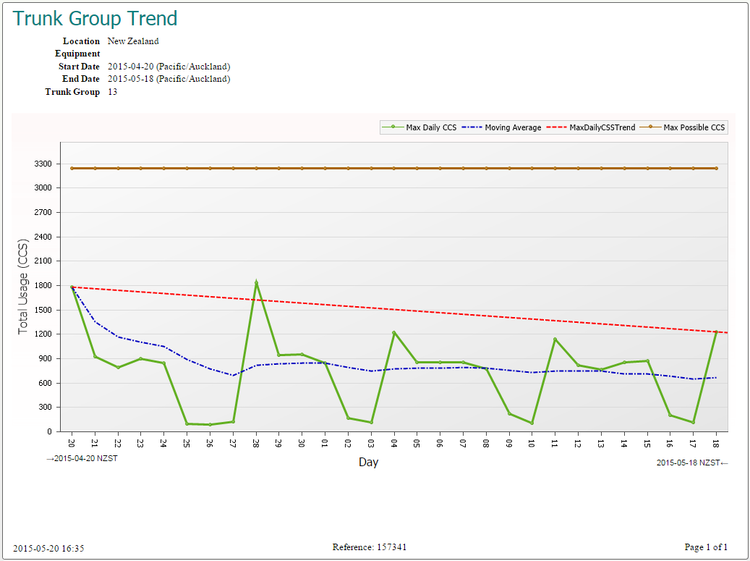
Trunk Group Trend Report Example 2
The graph below shows excess capacity on this trunk group can be retired, especially as we can see demand is reducing over time as shown by the red dotted line.