Paying for unused trunk capacity? Losing callers when trunks overload?
Either way, both scenarios cost money. But it doesn’t have to be this way. Keeping trunk capacity right-sized is easier than you think with VSM’s Trunk Group Summary Reports.
What is this report for?
- Measure every trunk group with one report
- See the peak loading of each
- Control costs without restricting business operations
Where do I find this report?
The Trunk Group Summary report is available in VSM’s Capacity Manager under Reports > Summary.
VSM’s growing library of useful real time dashlets and historic reports let you track utilization of hardware and software across your UC platform.
Trunk Group Summary Reporting in Action
Click on the screen to watch a demonstration of the Trunk Group Summary reporting.
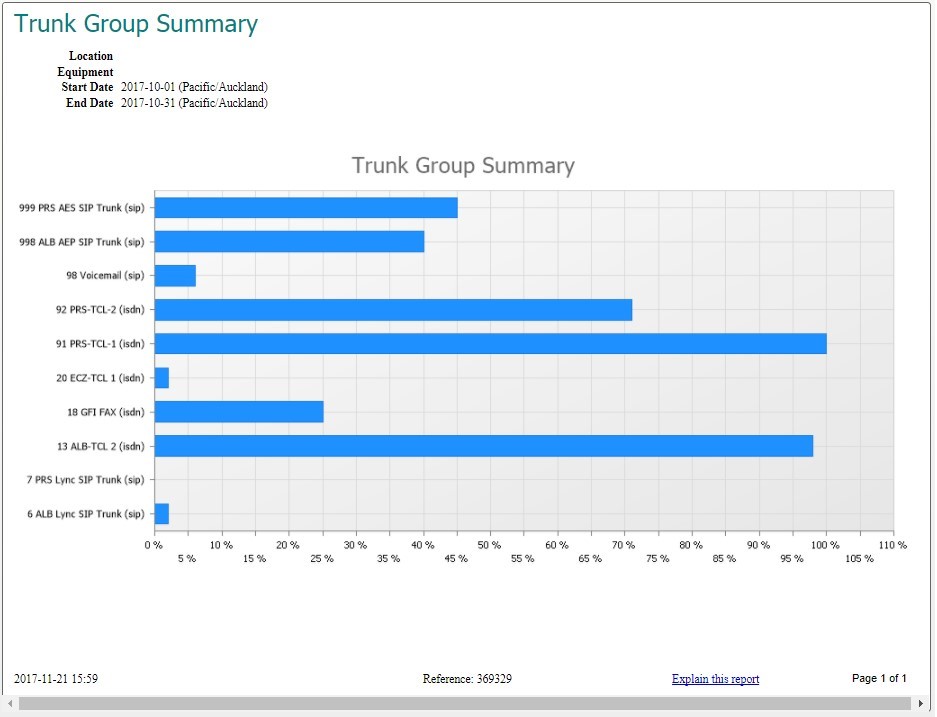
Trunk Group Summary Report Example
This report gives you a picture of the peak calls across your ACM trunks for a given period of time. Measurements are expressed as a percentage of equipped channels.
In this example:
- Trunk group 91 is hitting 100% occupancy, and may be blocking traffic. Alternate inbound and outbound arrangements need to be in place.
- Trunk group 20 has very little load and can be substantially reduced in size, saving operational costs.
- Internal SIP trunk groups like 6, 7 and 98 have low use, but have no recurring costs.