What are they for?
The dashlets provide a real time view of your Session Manager at a glance.
Significantly reduces time to repair by pinpointing the underlying cause of issues, and allows visualization of resource and bandwidth consumption.
VSM dashlets run the same diagnostic commands experienced engineers run when they are identifying problems. These commands are run on a minute to minute basis, and the results are displayed on a dashboard, color-coded to reflect solution health. Covering:
- Server hardware and operating system health
- Processor occupancy and uptime
- Software status
- SIP Entity status
- SIP Endpoint status
- SIP Session status
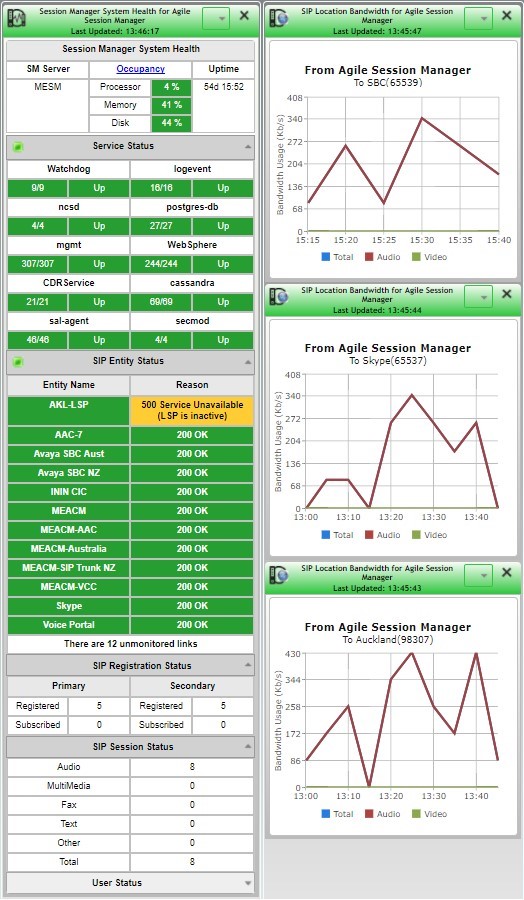
- SIP Bandwidth consumption
Where do I find them?
Dashlets are available in VSM’s Service Desk module. Service Desk contains a growing number of user-configurable dashlets that display health across your entire UC and CC platform.
Session Manager Dashlets in Action
Click on the screen to watch a demonstration of Session Manager dashlets.
Session Manager Dashlets Example
This Session Manager is running nicely:
- The server hardware and operating system is running and healthy
- The software services are all running and responsive
- Entities are up and connected to the remote applications
- The LSP is reachable, and ready to go if required
- SIP stations are registered
- Session Manager duplication is working for the SIP stations
- There are sessions in progress
Bandwidth consumed by SIP applications is broken down by media type for the following locations:
- Session Border Controller
- Avaya Communication Manager
- Skype for Business
- Experience portal
- Remote branches