What’s it for?
Provides a real time view of your session border controller (SBC) at a glance and significantly reduces time to repair by pin-pointing the underlying cause of issues.
VSM dashboards run the same diagnostic commands experienced engineers run when they are identifying problems. These commands are run on a minute to minute basis, and the results are displayed on a dashboard, colour-coded to reflect solution health.
Dashboards include:
- Server hardware and operating system health
- Processor occupancy and uptime
- Application status
- Sessions in progress
- SIP performance statistics
- SIP Security statistics
- SIP error codes
Where do I find it?
Dashboards are available in VSM’s Service Desk module. Service Desk contains a growing number of user-configurable dashboards that display health across your entire UC and CC platform.
SBC Dashboard in Action
Click on the screen to watch a demonstration of the Avaya SBC dashboard.
SBC Dashboard Example
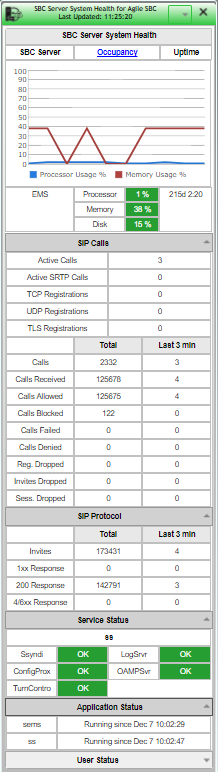
This SBC is running nicely:
- The server hardware and operating system is running and healthy
- The SBC applications are running
- Software services are running and responsive
- There are sessions in progress
- The security rules are not being put to the test
- There are no SIP failure codes being generated