What’s it for?
Provides a real time view of AEP at a glance and significantly reduces time to repair by pinpointing the underlying cause of issues.
VSM dashboards run the same diagnostic commands experienced engineers run when they are identifying problems. These commands are run on a minute to minute basis, and the results are displayed on a dashboard, color-coded to reflect solution health.
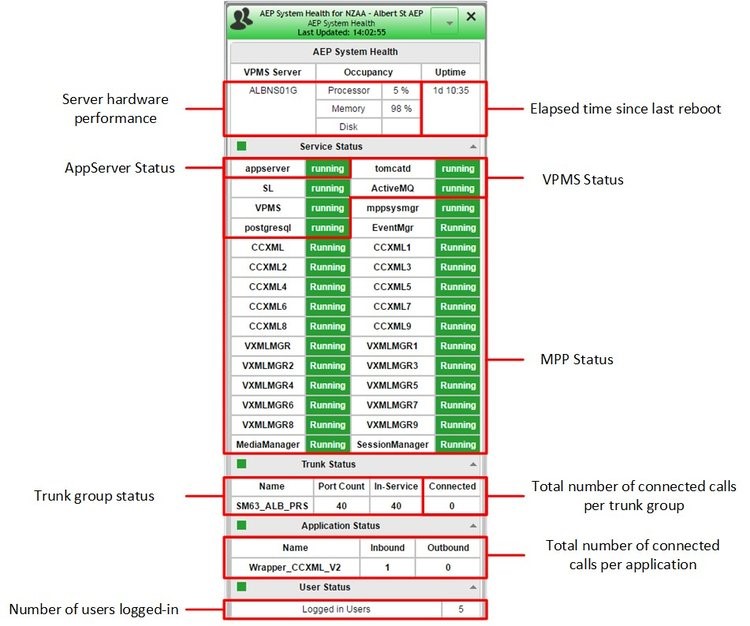
AEP Dashboard covers:
- Server hardware and OS health
- Processor Memory and Disk Occupancy
- Server Uptime
- State of Software Services
- AppServer
- VPMS
- MPP
- Trunk Group Status
- In-Service
- Traffic
- Applications Status
- Calls per Application
- Direction of Calls
- User Status
Where do I find it?
Dashboards are available in VSM’s Service Desk module. Service Desk contains a growing number of user-configurable dashboards that display health across your entire UC and CC platform.
AEP Dashboard in Action
Watch a demonstration of the AEP dashboard.
AEP Dashboard example: